Authorized System House of

Rarely a Straight Line
With machine learning there’s rarely a straight line from start to
finish—you’ll find yourself constantly iterating and trying different ideas and approaches. This chapter describes a systematic machine learning workflow, highlighting some key decision points along the way.
Machine Learning Challenges
Most machine learning challenges relate to handling your data and
finding the right model.
Data comes in all shapes and sizes. Real-world data-sets can be messy, incomplete, and in a variety of formats. You might just
have simple numeric data. But sometimes you’re combining several
different data types, such as sensor signals, text, and streaming
images from a camera.
Preprocessing your data might require specialized knowledge and tools. For example, to select features to train an object detection algorithm requires specialized knowledge of image processing. Different types of data require different approaches to preprocessing.
It takes time to find the best model to fit the data. Choosing the right model is a balancing act. Highly flexible models tend to over-fit data by modeling minor variations that could be noise. On the other hand, simple models may assume too much. There are always trade-offs between model speed, accuracy, and complexity.

Sounds daunting? Don’t be discouraged. Remember that trial and error is at the core of machine learning—if one approach or algorithm doesn’t work, you simply try another. But a systematic
workflow will help you get off to a smooth start.
Questions to Consider Before You Start
Every machine learning workflow begins with three questions:
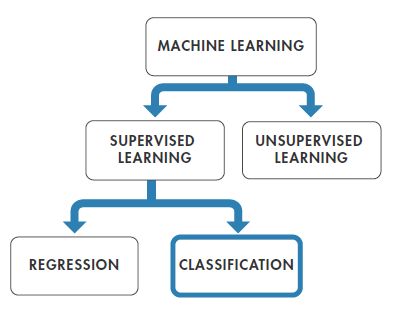
Your answers to these questions help you decide whether to use
supervised or unsupervised learning.
Choose supervised learning if you need to train a model to make a prediction–for example, the future value of a continuous variable, such as temperature or a stock price, or a classification—for example, identify makes of cars from webcam video footage.
Choose unsupervised learning if you need to explore your data and want to train a model to find a good internal representation, such as splitting data up into clusters.
Workflow at a Glance
In the next sections we’ll look at the steps in more detail, using a
health monitoring app for illustration. The entire workflow will be
completed in MAT LAB.

Training a Model to Classify Physical Activities
This example is based on a cell phone health-monitoring app. The input consists of three-axial sensor data from the phone’s accelerometer and gyroscope. The responses, (or output), are the
activities performed–walking, standing, running, climbing stairs,
or lying down.
We want to use the input data to train a classification model to
identify these activities. Since our goal is classification, we’ll be
applying supervised learning.
The trained model (or classifier) will be integrated into an app to
help users track their activity levels throughout the day.

1 Step One: Load the Data
To load data from the accelerometer and gyroscope we do the following:
We store the labeled data sets in a text file. A flat file format such
as text or CSV is easy to work with and makes it straightforward to
import data.

Machine learning algorithms aren’t smart enough to tell the difference between noise and valuable information. Before using the data for training, we need to make sure it’s clean and complete.
2 Step Two: Preprocess the Data
We import the data into MAT LAB and plot each labeled set. To preprocess the data we do the following:
We must decide whether the outliers can be ignored or whether they indicate a phenomenon that the model should account for. In our example, they can safely be ignored (it turns out that we moved unintentionally while recording the data).
We could simply ignore the missing values, but this will reduce
the size of the data set. Alternatively, we could substitute approximations for the missing values by interpolating or using
comparable data from another sample.
In many applications, outliers provide crucial information. For example, in a credit card fraud detection app, they indicate purchases that fall outside a customer’s usual buying patterns.

3. Remove gravitational effects from the accelerometer data so that our algorithm will focus on the movement of the subject, not the movement of the phone. A simple high-pass filter such as a bi-quad filter is commonly used for this.
4. Divide the data into two sets. We save part of the data for testing (the test set) and use the rest (the training set) to build models. This is referred to as holdout, and is a useful cross validation technique.
By testing your model against data that wasn’t used in the modeling process, you see how it will perform with unknown data.

3 Step Three: Derive Features
Deriving features (also known as feature engineering or feature
extraction) is one of the most important parts of machine learning.
It turns raw data into information that a machine learning algorithm can use.
For the activity tracker, we want to extract features that capture the
frequency content of the accelerometer data. These features will
help the algorithm distinguish between walking (low frequency)
and running (high frequency). We create a new table that includes
the selected features.
Use feature selection to:

The number of features that you could derive is limited only by your imagination. However, there are a lot of techniques commonly used for different types of data.

4 Step Four: Build and Train the Model
When building a model, it’s a good idea to start with something
simple; it will be faster to run and easier to interpret. We start with a basic decision tree.

To see how well it performs, we plot the confusion matrix, a table
that compares the classifications made by the model with the actual class labels that we created in step 1.

The confusion matrix shows that our model is having trouble
distinguishing between dancing and running. Maybe a decision
tree doesn’t work for this type of data. We’ll try a few different algorithms.
We start with a K-nearest neighbors (KNN), a simple algorithm that stores all the training data, compares new points to the training data, and returns the most frequent class of the “K” nearest points. That gives us 98% accuracy compared to 94.1% for the simple decision tree. The confusion matrix looks better, too:

However, KNNs take a considerable amount of memory to run,
since they require all the training data to make a prediction.
We try a linear discriminant model, but that doesn’t improve the
results. Finally, we try a multi-class support vector machine (SVM).
The SVM does very well—we now get 99% accuracy:

We achieved our goal by iterating on the model and trying different algorithms. If our classifier still couldn’t reliably differentiate between dancing and running, we’d look into ways to improve the model.
5 Step Five: Improve the Model
Improving a model can take two different directions: make the
model simpler or add complexity.
Simplify
First, we look for opportunities to reduce the number of features.
Popular feature reduction techniques include:
Next, we look at ways to reduce the model itself. We can
do this by:

A good model includes only the features with the most predictive power. A simple model that generalizes well is better than a complex model that may not generalize or train well to new data.
In machine learning, as in many other computational processes, simplifying the model makes it easier to understand, more robust, and more computationally efficient.
Add Complexity
If our model can’t differentiate dancing from running because it is
over-generalizing, then we need find ways to make it more
fine-tuned. To do this we can either:
Once we’ve adjusted the model, we validate its performance on the test data that we set aside during preprocessing.
If the model can reliably classify activities on the test data, we’re
ready to move it to the phone and start tracking.
