Authorized System House of

Technology advances have blurred the boundaries between the digital and physical worlds, and given rise to the next great industrial revolution known as the Industrial Internet of Things or Industry 4.0. As a result, today’s factories require intelligent, interconnected systems linked to cloud services and big data analysis to drive greater manufacturing efficiency, flexibility, and responsiveness.
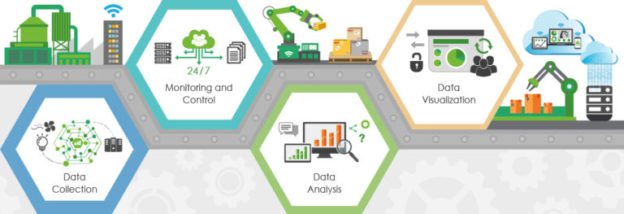
DATA COLLECTION
Machine Data Collection is an application that connects to your machines and sensors to generate real-time operations data. This allows you to track asset uptime, error conditions and enhance manually collected data.
The data collection software automatically collects a wealth of information specific to machining processes and presents it in an intuitive format so users can quickly analyze the data and implement changes.

Data collection systems provide the following functionality:
MONITORING AND CONTROL
Monitoring and controlling is the process of tracking, reviewing, and regulating the progress in order to meet the performance objectives.
There are many industries with different production lines and some of the process in industries cannot be monitored by human near the production line. The industry may be a small scale or a huge one there are some restricted areas that has to be monitored. There are different process running in each industry, but the security and the safety of the industry is the same in every industry.

There are some places in the industry where humans are not allowed like power plant or the grid where you can use PIR and camera to monitor. In industries the safety is also very important, as there will be some flammable substance in the industry you can monitor flammable gas like iso-butane, propane, LPG, alcohol and smoke with the MQ6 sensor and you can prevent explosion in the industry by evacuating the room and then exhaust the gas. You can also use vibration sensor for the monitoring the smooth operations of the machines.
DATA ANALYSIS
Data analysis is a process of inspecting, cleansing, transforming, and modeling data with the goal of discovering useful information, informing conclusions, and supporting decision-making.

The process of evaluating data using analytical and logical reasoning to examine each component of the data provided. This form of analysis is just one of the many steps that must be completed when conducting a research experiment. Data from various sources is gathered, reviewed, and then analyzed to form some sort of finding or conclusion. There are a variety of specific data analysis method, some of which include data mining, text analytics, business intelligence, and data visualizations.
DATA VISUALIZATION
Data visualization is the graphical representation of information and data. By using visual elements like charts, graphs, and maps, data visualization tools provide an accessible way to see and understand trends, outliers, and patterns in data.

In the world of Big Data, data visualization tools and technologies are essential to analyze massive amounts of information and make data-driven decisions.
